I recently made the move from basic MRTG graphing for some of my networked equipment to Observium, and I’m quite happy that I did.
Why am I happy that I changed systems? Well, it’s multi-part, but it can all be summed up in two words, “it’s better”.
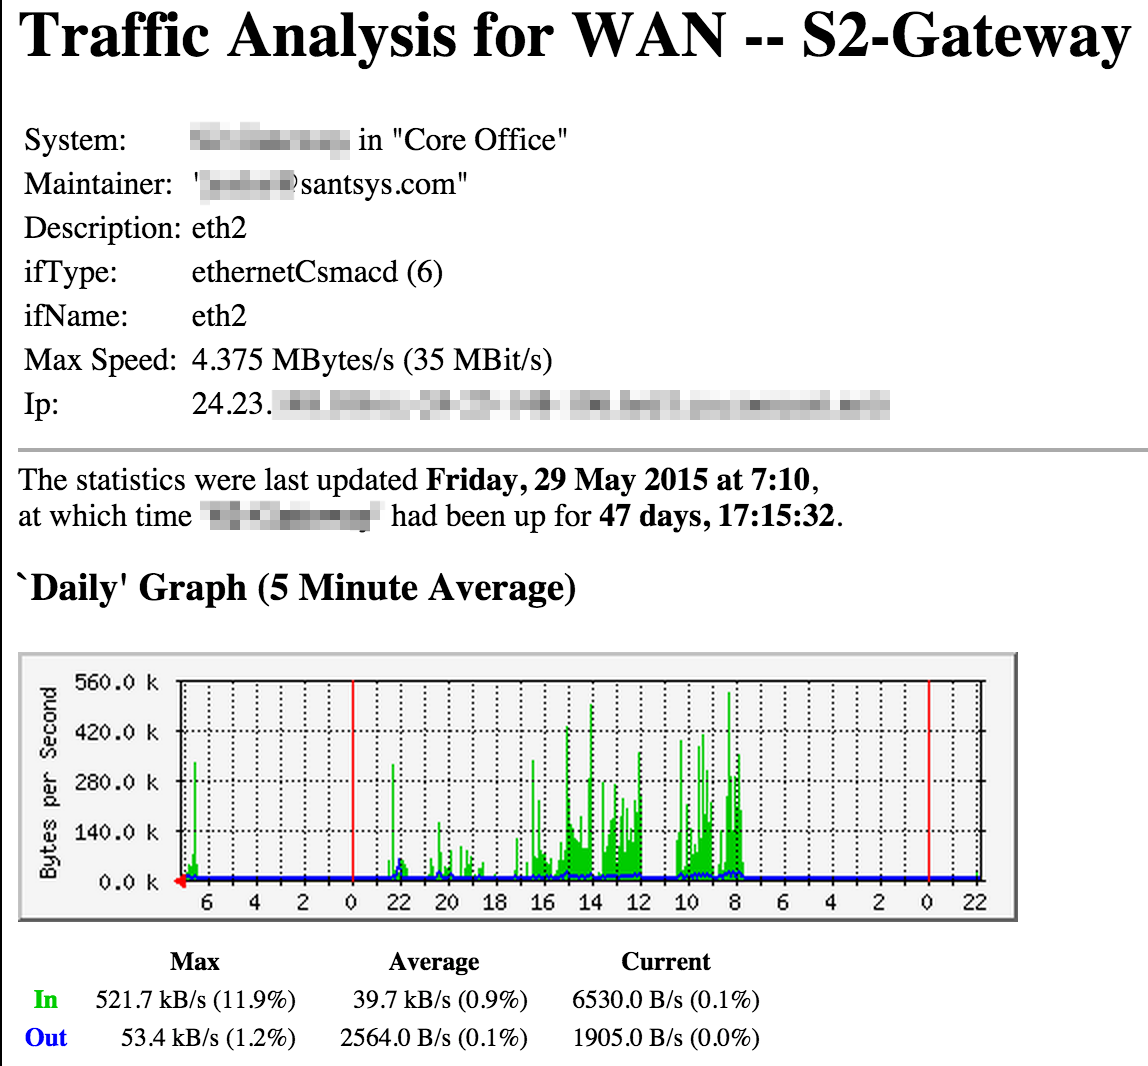
MRTG is an old system, it’s light weight, but it hasn’t really been updated since 2012-ish… The last stable release is dated Jan 12, 2012 (version 2.17.4). Because of this, it’s really manual. It takes a lot of work to get NiBs and reliable monitoring of devices, and the charts are well, pretty plain. Bottom line, using MRTG as a monitoring solution doesn’t offer a whole lot of features.
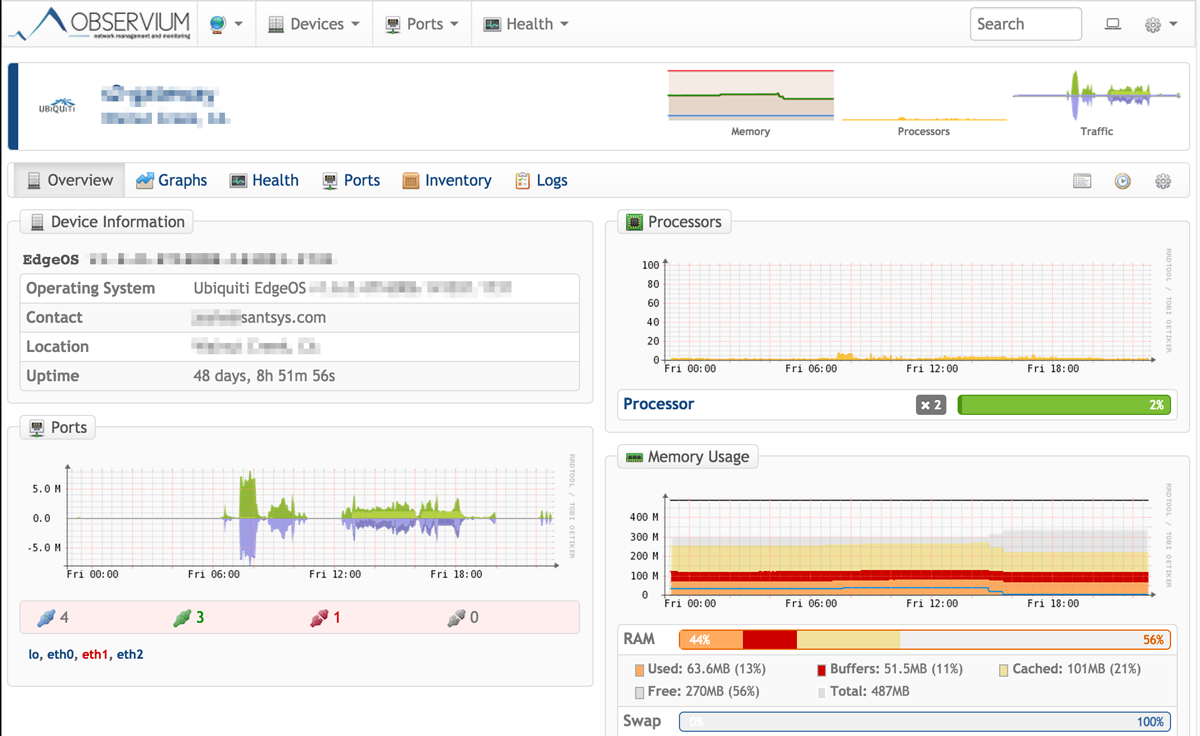
Observium, on the other hand, is much more modern and supports a ton of devices right out of the box. It’s a little heavy as far as an application goes, well, compared to MRTG, but overall the features and information it provides with almost no work is well worth it.
Installing Observium
Observium is a pretty straight forward installation, the instructions are here.
I followed Observiums instructions, which are pretty easy to follow and only a few steps, pretty much completely with only a few teaks. You do need a little experience with Linux, but nothing crazy. The only change I made was to run Observium under a different port in Apache because I use the server for multiple websites and Observium has to be run at the root of a site, not in a subdirectory. But with that change, everything works great.
My configuration file for Apache looks something like this (instead of what they recommend in the instructions). This runs Observium on port 3000 (http://127.0.0.1:3000/).
# Config file for Observium
# /etc/httpd/conf.d/observium.conf

Listen 3000

<VirtualHost *:3000>
  DocumentRoot /opt/observium/html/
  CustomLog /opt/observium/logs/access_log combined
  ErrorLog /opt/observium/logs/error_log
  <Directory "/opt/observium/html/">
   AllowOverride All
   Options FollowSymLinks MultiViews
  </Directory>
</VirtualHost>
Connecting to Hosts
One “gotcha” with Observium is that it requires host names. You cannot connect to an SNMP enabled host via its IP address. This can be problematic if you don’t run your own internal DNS server. But a quick and simple way to handle that is to add host entries on the server you are running Observium on.
$ ping myrouter
ping: cannot resolve myrouter: Unknown host
To add host entries on CentOS (and I think almost all Linux distributions) just add entries in the form of IP Address then Host Name, one per line to the /etc/hosts file. You can do the same thing in Windows in the C:\Windows\System32\Drivers\etc\hosts file.
10.0.0.1   MyRouter
10.0.0.2   MyServer
10.0.0.10  MyNAS
Then you can use the names listed in the hosts file when adding the devices to Observium. You can test that the resolution is working correctly by running a ping command after adding the hosts entries.
$ ping myrouter
PING myrouter (10.0.0.1) 56(84) bytes of data.
64 bytes from myrouter (10.0.0.1): icmp_seq=1 ttl=64 time=0.717 ms
64 bytes from myrouter (10.0.0.1): icmp_seq=2 ttl=64 time=0.802 ms
64 bytes from myrouter (10.0.0.1): icmp_seq=3 ttl=64 time=0.765 ms
64 bytes from myrouter (10.0.0.1): icmp_seq=4 ttl=64 time=0.787 ms
64 bytes from myrouter (10.0.0.1): icmp_seq=5 ttl=64 time=0.745 ms
64 bytes from myrouter (10.0.0.1): icmp_seq=6 ttl=64 time=1.37 ms

--- s2-gateway ping statistics ---
6 packets transmitted, 6 received, 0% packet loss, time 5049ms
rtt min/avg/max/mdev = 0.717/0.865/1.375/0.230 ms
All Done!
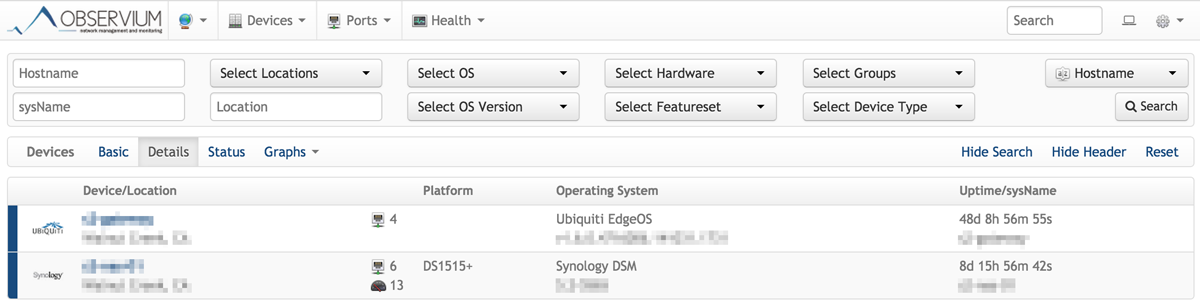
Once you have things setup and running and devices added per the instructions, the only thing left to do is to wait for data to start populating. The dashboard isn’t always the most awesome thing, but it gives a lot of information, especially if you’re using SNMP v2c or greater.
Digging into the port level information and other various information shown via SNMP, all in a central location, can be a great help in monitoring you systems.
What network monitoring and logging systems do you use and like? Have any suggestions or comments, please leave them in the comments section below. Thanks!